
Last fall, at PACK EXPO Connects, we offered virtual demos of our Garvey Line Analysis. In the video below, company president Tom Garvey and VP of sales Mike Earling walk you through the line analysis process to show you how we can use this tool to find the weakest points in your line and how accumulation can help you maximize your throughput.
Edited transcript
Tom Garvey: Hello, and thanks for joining us today at the virtual PACK EXPO. Today, we’re going to be talking about a line analysis. It’s something that our company provides for its customers. We go in and analyze a line to see if you need accumulation, and if you do, where to place it to be most effective in your production line. Mike Earling is an expert, and he’s going to give you more details after we watch a short video describing the basics of a Garvey Line Analysis.
[Video] Hello, my name is Tom Garvey, and I’m going to give you a brief overview of our Garvey Line Analysis and how we use the theory of constraints to maximize your productions. Here we have a typical wine bottling line. We did a Garvey Line Analysis on this line and determined that the filler was the constraint. It’s capable of doing 167 bottles per minute, yet the line is only producing 130. That’s because anytime one of the other machines in that line stops, it stops the filler. Bottles back up, cause the filler to stop. What we do is strategically place buffers in the line, in this case it was our Infinity Accumulation systems, to protect that constraint. Now, when one of the other machines stops, it doesn’t stop that filler. Instead, the labeler stops, the accumulation system starts to fill up, and the filler can keep running. When this labeler starts running again, it runs faster than the constraint and it will deplete that accumulation system, allowing it to be a buffer again. By strategically placing these buffers in the line, productivity went up 28.4% from 130 bottles, a minute to 167.
Tom Garvey: Thanks for watching. Now, Mike’s done hundreds of these line analyses for customers, and he has a lot more detailed information, also a lot of common questions that we get asked during these line analysis situations. So Mike, do you want to go ahead?
Mike Earling: Yes, I’m Mike Earling, I’m vice president of sales here, and the reason why we do our line analysis is actually two reasons. The first reason is to try to help our customers increase throughput. The second reason is to have us understand what you go through every single day. And once we understand that, that’s when we can try to help you out. So what we have here is a short presentation of what a typical line is. This is a slow line, but we will work with faster lines and actually slower lines than this as well. But the whole idea behind what we’re doing is to try to find the constraint on the line and never have your other machines shut that constraint down.
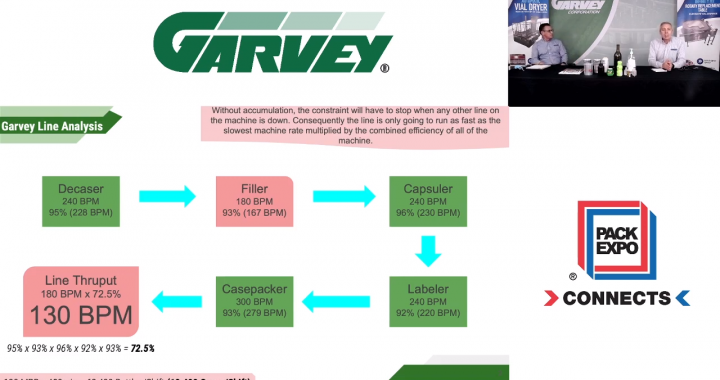
When you do not have accumulation in the line, the line is working as one group. And what happens with that one group is when one machine stops, the whole line goes down. So in this case, you have five different machines. This is a typical wine line — you have a decaser, a filler, capsular, labeler, casepacker. And each one of those machines has their own efficiency, has their own design rate, and has its own throughput. And when all the machines are running together, it’s only going to run as fast as what the filler can run. But in this case, the decaser can run 240 a minute, and it runs about 96% uptime. And we can help gather that information with you. We ask two pieces of information: mean time to repair a machine and mean time between failures.
And that’s how we come up with the efficiency of that machine. Multiplied by the products per minute of what the design rate of that machine is. So in this case, you have your decaser that runs at 240. You have your filler running at 180 at 93%. You have your case packer at 240 running at 96%. You have your labeler running at 240 at 92%, and you have your casepacker running at 300 at 93%. And as you can tell, we have the filler highlighted as being the constraining operation because it has the slowest throughput out of the grouping. But the line can only produce 130 bottles per minute, because all those efficiencies multiplied together equals a runtime of 92% multiplied by the filler speed at 180, which will give you 130 bottles a minute. And at the end of the day, or at the end of that shift, that equates to about 10,400 cases per shift.
So, what we look at now is we try to break that grouping into smaller groups. And in this case, we identify the constraint, which is the filler, and we buffer before and after. So, we added two Infinities and now the casepacker, labeler, and capsular is one group. The filler is another group. And the decaser is a group on its own as well. And with this, the line is going to produce at 167 bottles a minute because we broke it apart into three different groups. So the overall increase in throughput is 28%. And now this company is averaging 13,360 cases per shift, which is a pretty big increase in throughput. And that is typical on almost all the lines that we work on and do a line analysis.
And all we’re looking at is the short little downtimes of between one and four minutes. Those downtimes happen consistently. Any downtime that’s more than five minutes we’re not looking at because it doesn’t happen very often. But in this case, we’re increasing the throughput to 167 bottles per minute, that’s the best the line can do because that’s the filler’s throughput. And at the end of the day, if they make 80 cents profit per bottle, the increase in throughput is $3.5 million of extra profit per year. So it’s a huge increase in productivity, and the justification is there because with a year payback, you can buy multiple systems.
Tom Garvey: The interesting thing is that even though all the machines are running at above 90% efficiency, when there’s no accumulation or no buffers in that line, that overall efficiency is down to 72%. It’s hard to comprehend, but it does make sense as to why people would want to get these each machine to be more efficient, but when you add buffers, it’s not necessary. And it’s a lot of times more expensive to get one of those secondary machines other than the constraint running at a faster rate because it wouldn’t impact the overall throughput of the line very much. Putting that buffer in place has an immediate effect. It’s amazing once we can show the math and see how efficient one buffer will make a production line. And it’s the most cost effective way to do it as well. The payback on our machines is usually within a few months. The machine is paid for by the increase in productivity.
Mike Earling: So if you have any questions or if you would like for us to do a line analysis for you or your company, please let us know. We’d be glad to do it.